By Jason Parker, RICP®
The bucket strategy is one of the most popular ways to think about retirement income. It is also one of the most debated. Some say it protects you from bad markets. Others say it is just a regular portfolio in disguise. So we tested it against history.
One note before the results: this article is about one specific kind of bucket plan, where each time period has its own mix of stocks and bonds, not about every bucket strategy. How the buckets are built changes what you get.
The short version: a bucket plan that starts out like a 60/40 portfolio and steadily becomes more stock-heavy held up well in most historical starting years. It did best in the weak cases, which is where retirees get hurt. It did not win everywhere, and no strategy survived the worst starting years.
What we tested
We imagined a retiree with $1,000,000 who spends $40,000 a year (4%), raised each year for inflation, over 30 years. All results are in today's dollars.
The money is split into four buckets. The dollar amounts below are in today's dollars: three years of the first year's $40,000 spending is $120,000. Spending rises with inflation each year, so the actual dollars spent grow over time, and we measure everything in today's dollars so that the buckets and the results stay comparable from year to year.
The rules are simple. Spend Bucket 1 first. When it is empty, spend Bucket 2, then Bucket 3, then Bucket 4. Buckets are never refilled. Each year, Buckets 2, 3 and 4 are rebalanced within themselves. Rebalancing means selling what has risen and buying what has fallen to bring each bucket back to its own mix. Bucket 1 is just cash.
Then we ran this plan through every possible 30-year retirement that could start between 1928 and 1995. That is 68 different starting years. Each retirement lasts 30 years, so the last one, starting in 1995, runs through 2024. Together they cover the Great Depression, the inflation of the 1970s, the dot-com crash and the 2008 crisis, though the later events show up partway through the retirements that started in the 1980s and 1990s. Someone who retired right before 2000 or in 2007 is not included, because they do not yet have 30 years of history.
We compared it to three plain portfolios that hold a fixed mix of stocks and bonds the whole time, rebalanced back to that mix every year: 60/40, 70/30 and 80/20.
The idea: a rising stock allocation
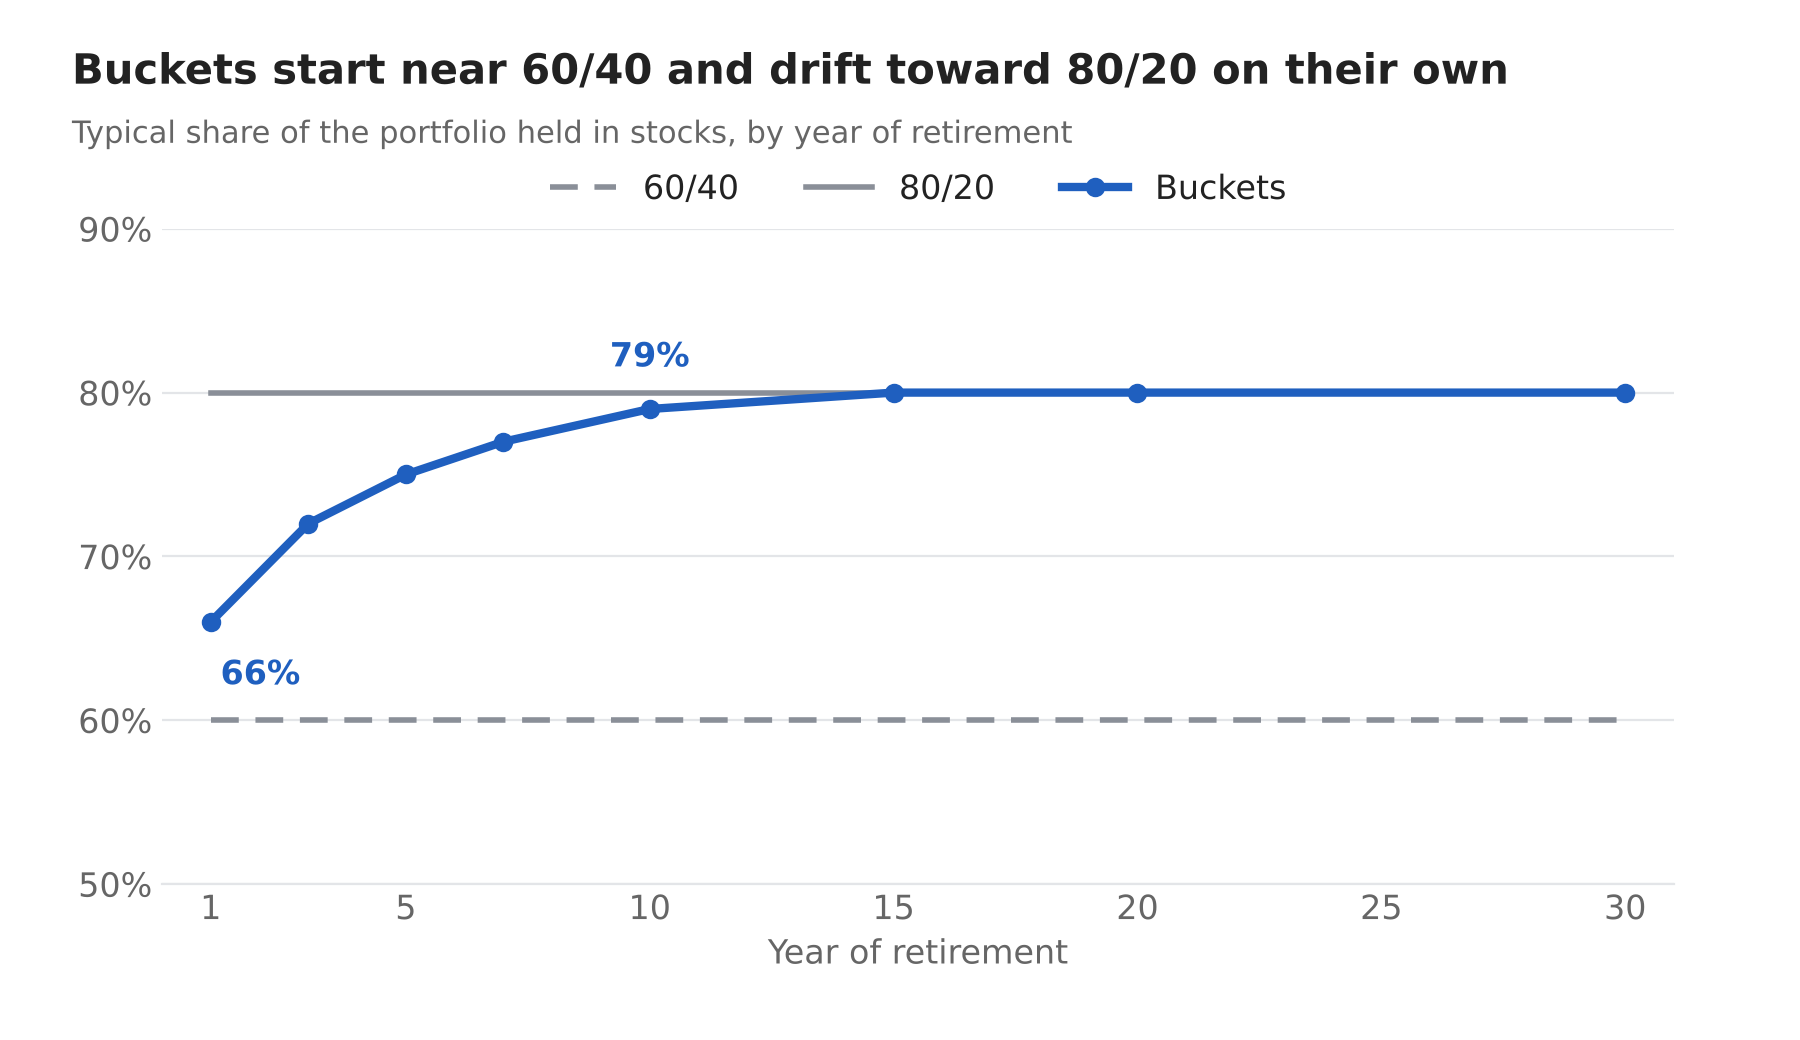
Because the buckets are spent in order and never refilled, the money left over gets steadily more stock-heavy. The retiree starts at about 64% stocks. By year 10 the typical portfolio is at about 80%.
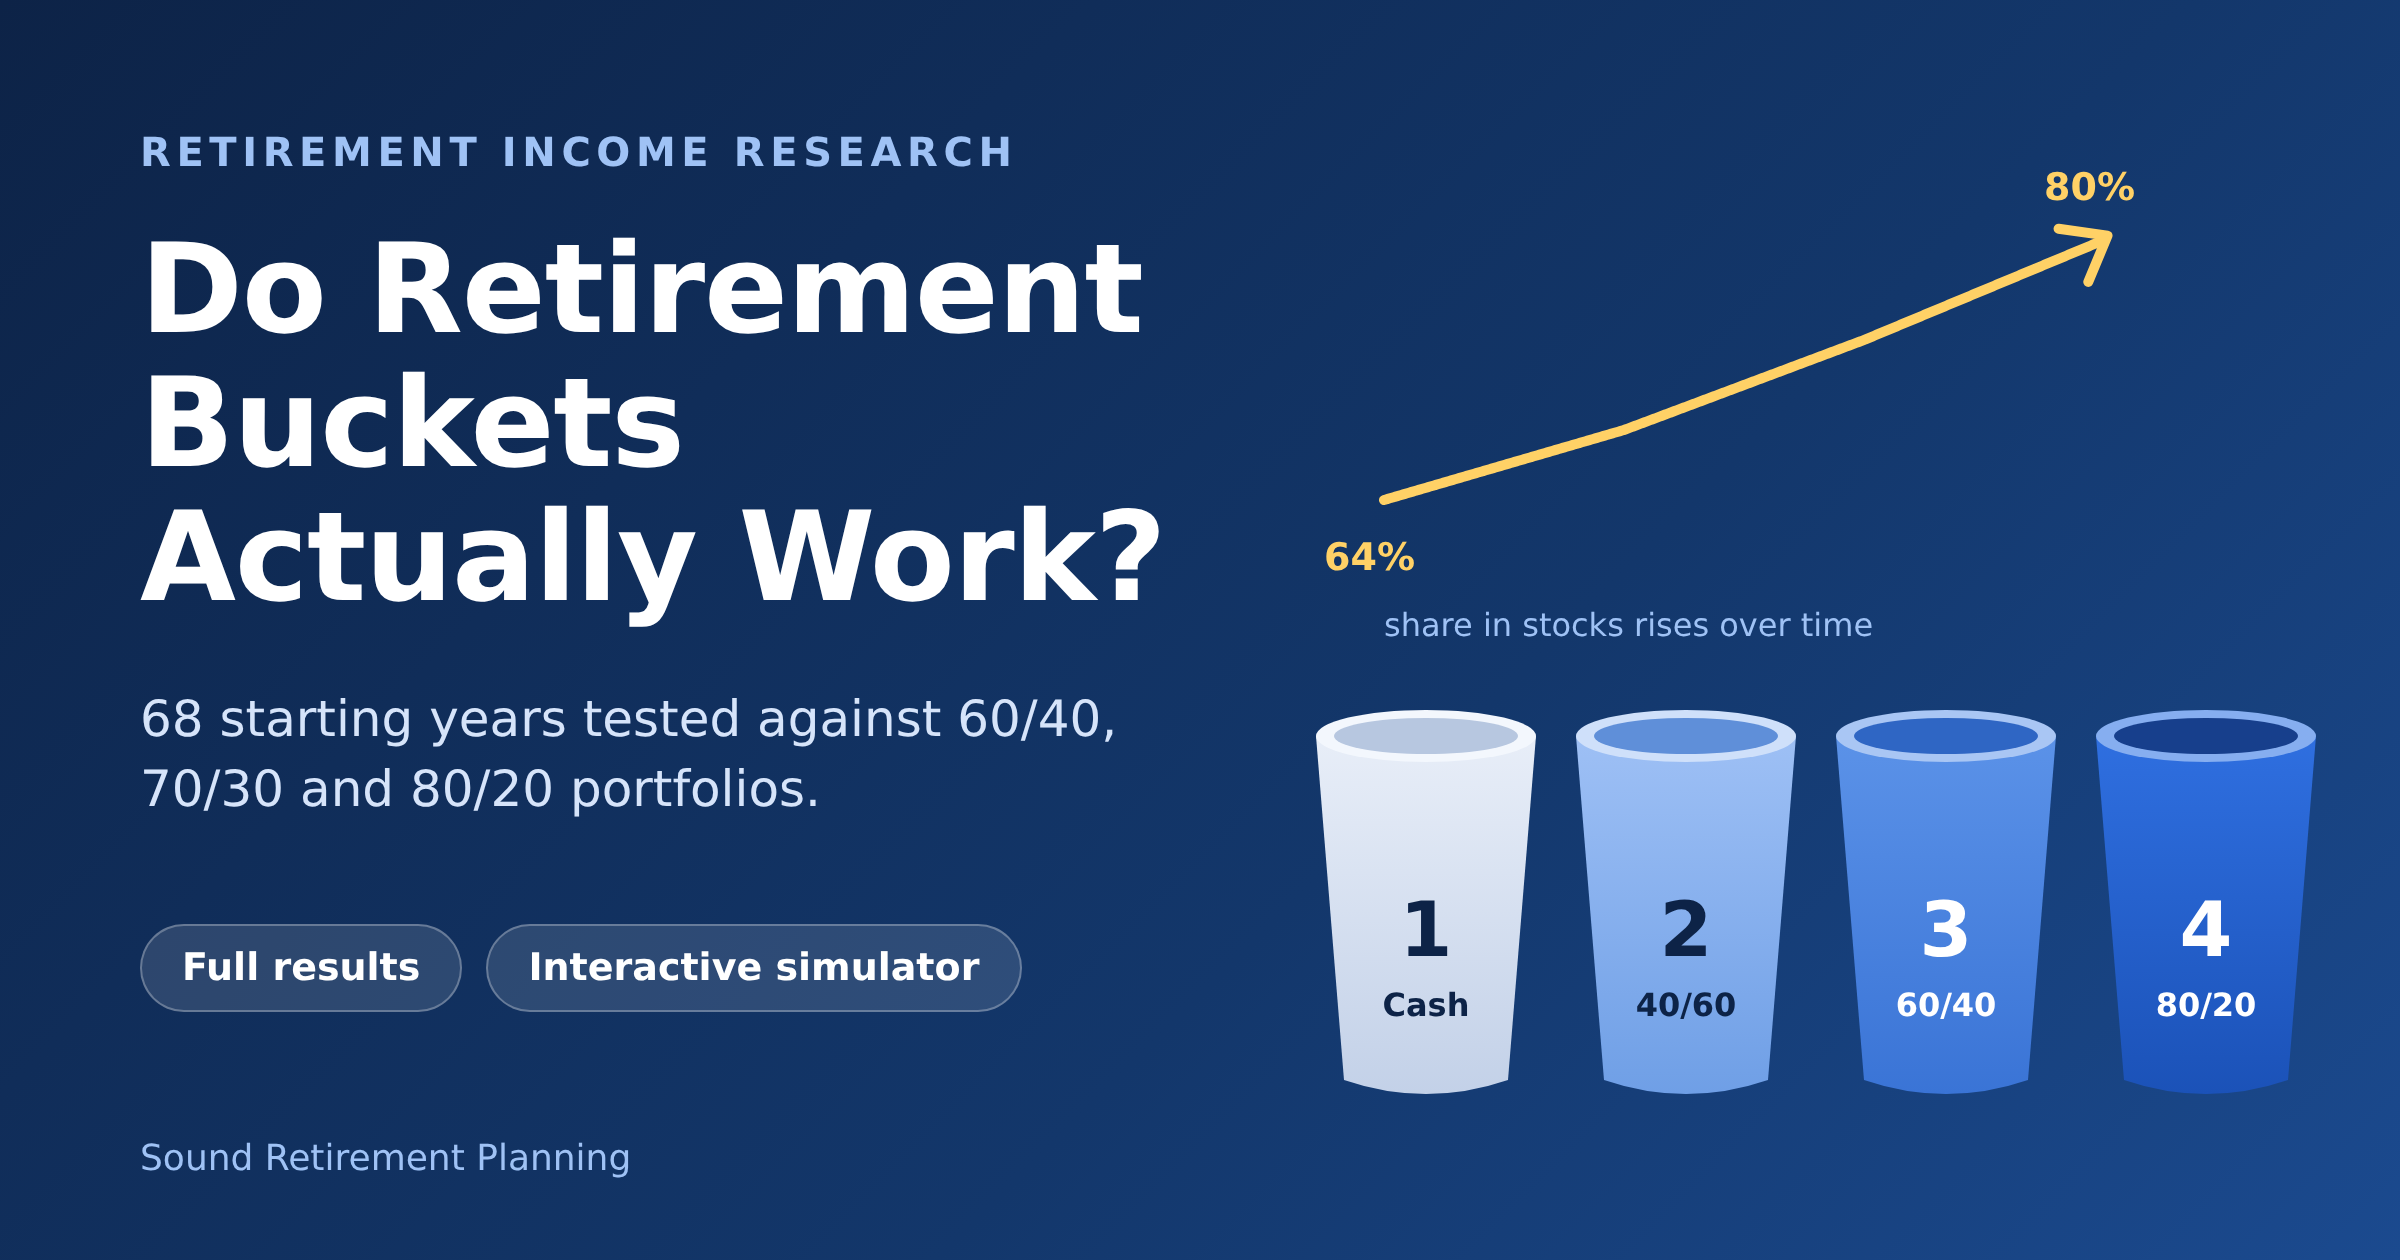
That is on purpose. The money in Buckets 2, 3 and 4 will not be touched for 3, 6 and 9+ years. It has time to ride out a market drop. And by the time the 80/20 bucket is needed, only about 20 years of retirement remain.
The goal is to protect the first 10 years of retirement, when a bad market does the most damage, while still keeping growth for later.
Sound Retirement Planning analysis of Damodaran (NYU Stern) data, 1928-2024 starting years. Hypothetical.
The grey lines are plain portfolios that never change. The blue line is the bucket plan, which changes on its own as the lower-risk buckets are spent.
The results
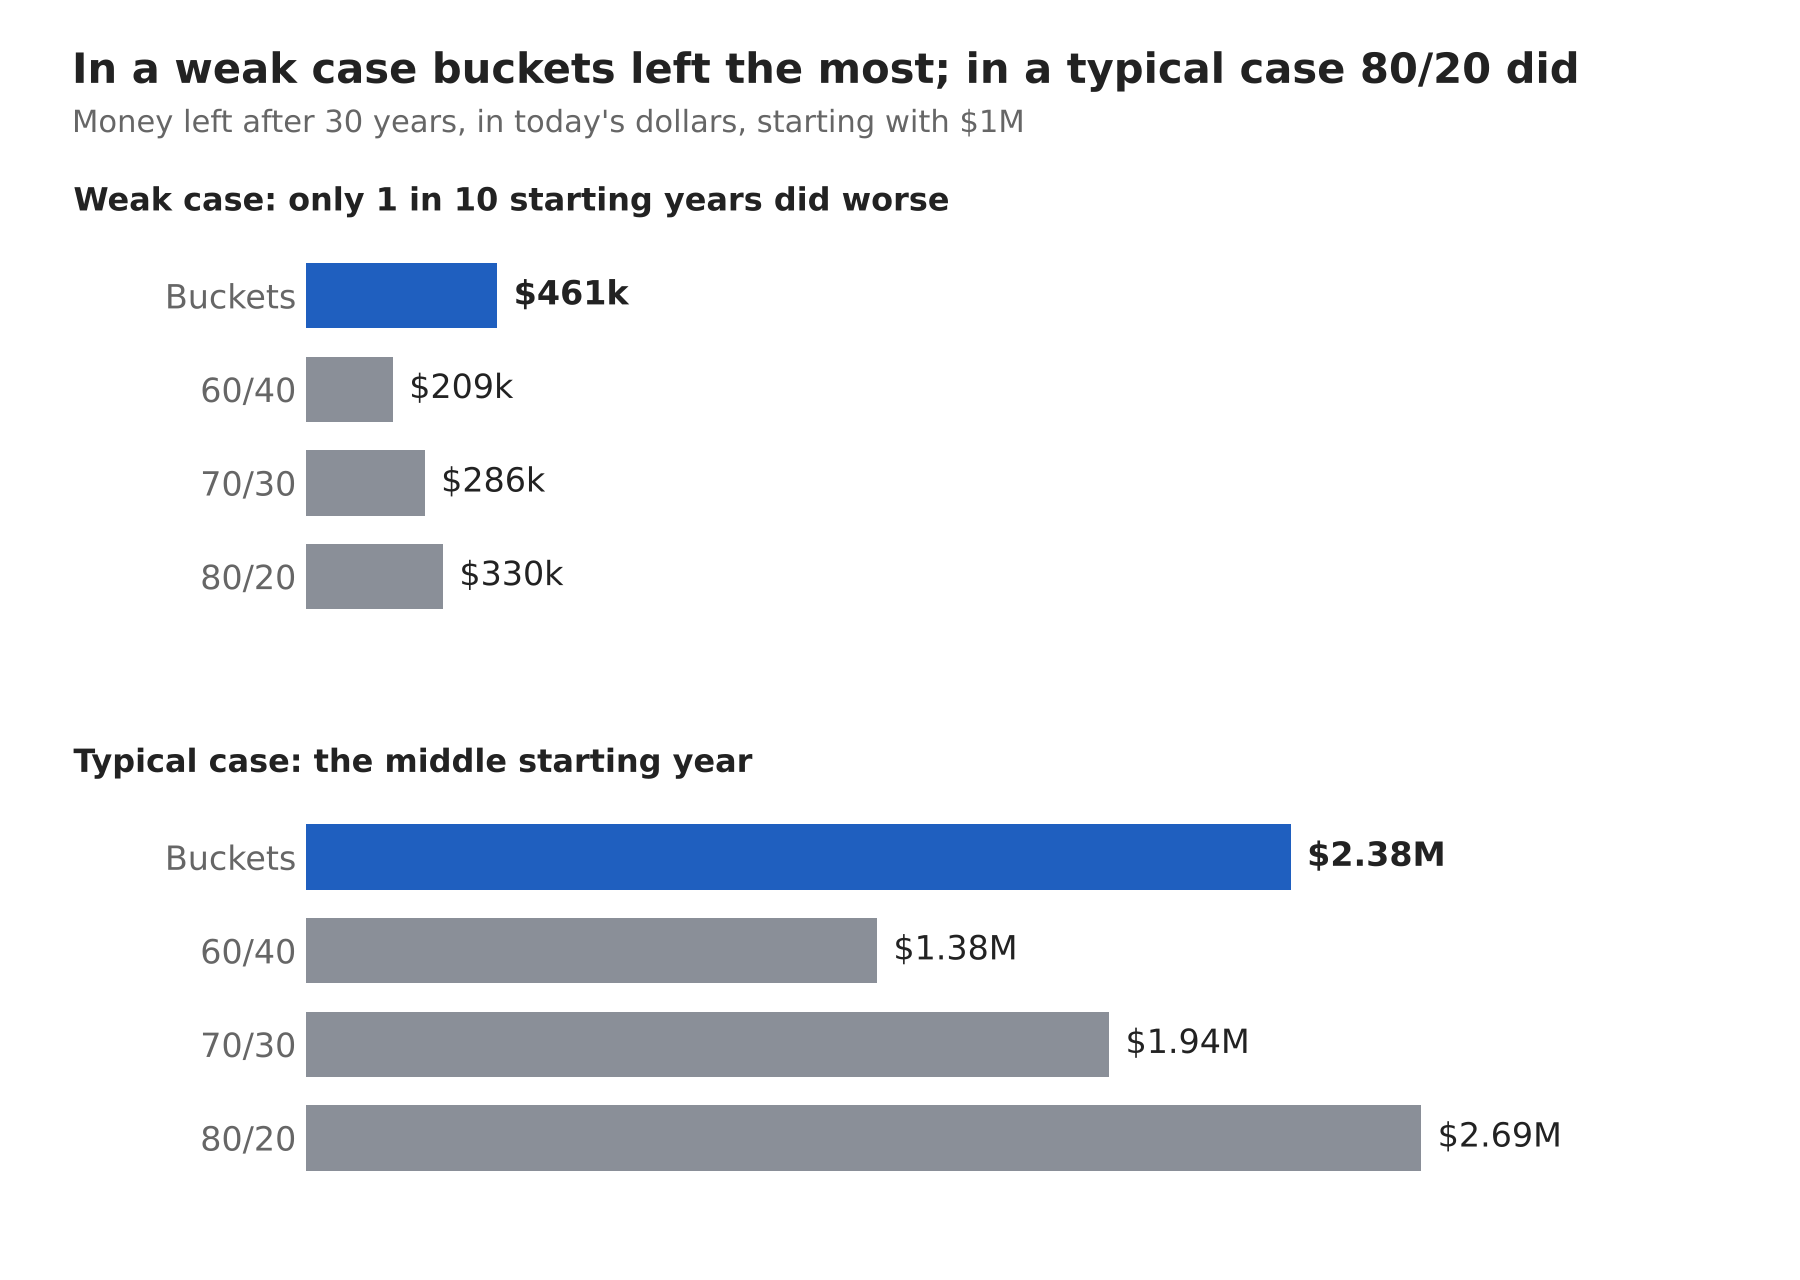
*Weak case means the 10th percentile: only 1 in 10 starting years did worse. Typical means the median. The plain portfolios are rebalanced to their target mix every year.
What stands out
- Against 60/40, the buckets never finished lower and finished higher in 65 of 68 periods (the other three tied at zero). Part of the reason is simply that they end up holding more stocks.
- The weak case is where buckets shine. Their final balance in the weak case ($461k) was the best of the four. The 60/40 portfolio's was less than half of that ($209k).
- Against 80/20, buckets gave up some upside. The typical final balance was $2.38M versus $2.69M, and the buckets finished ahead in only 15 of 68 periods. In exchange they did much better when the market started badly.
Sound Retirement Planning analysis of Damodaran (NYU Stern) data, 68 thirty-year periods starting 1928-1995. Hypothetical.
A closer look: retiring in 1973
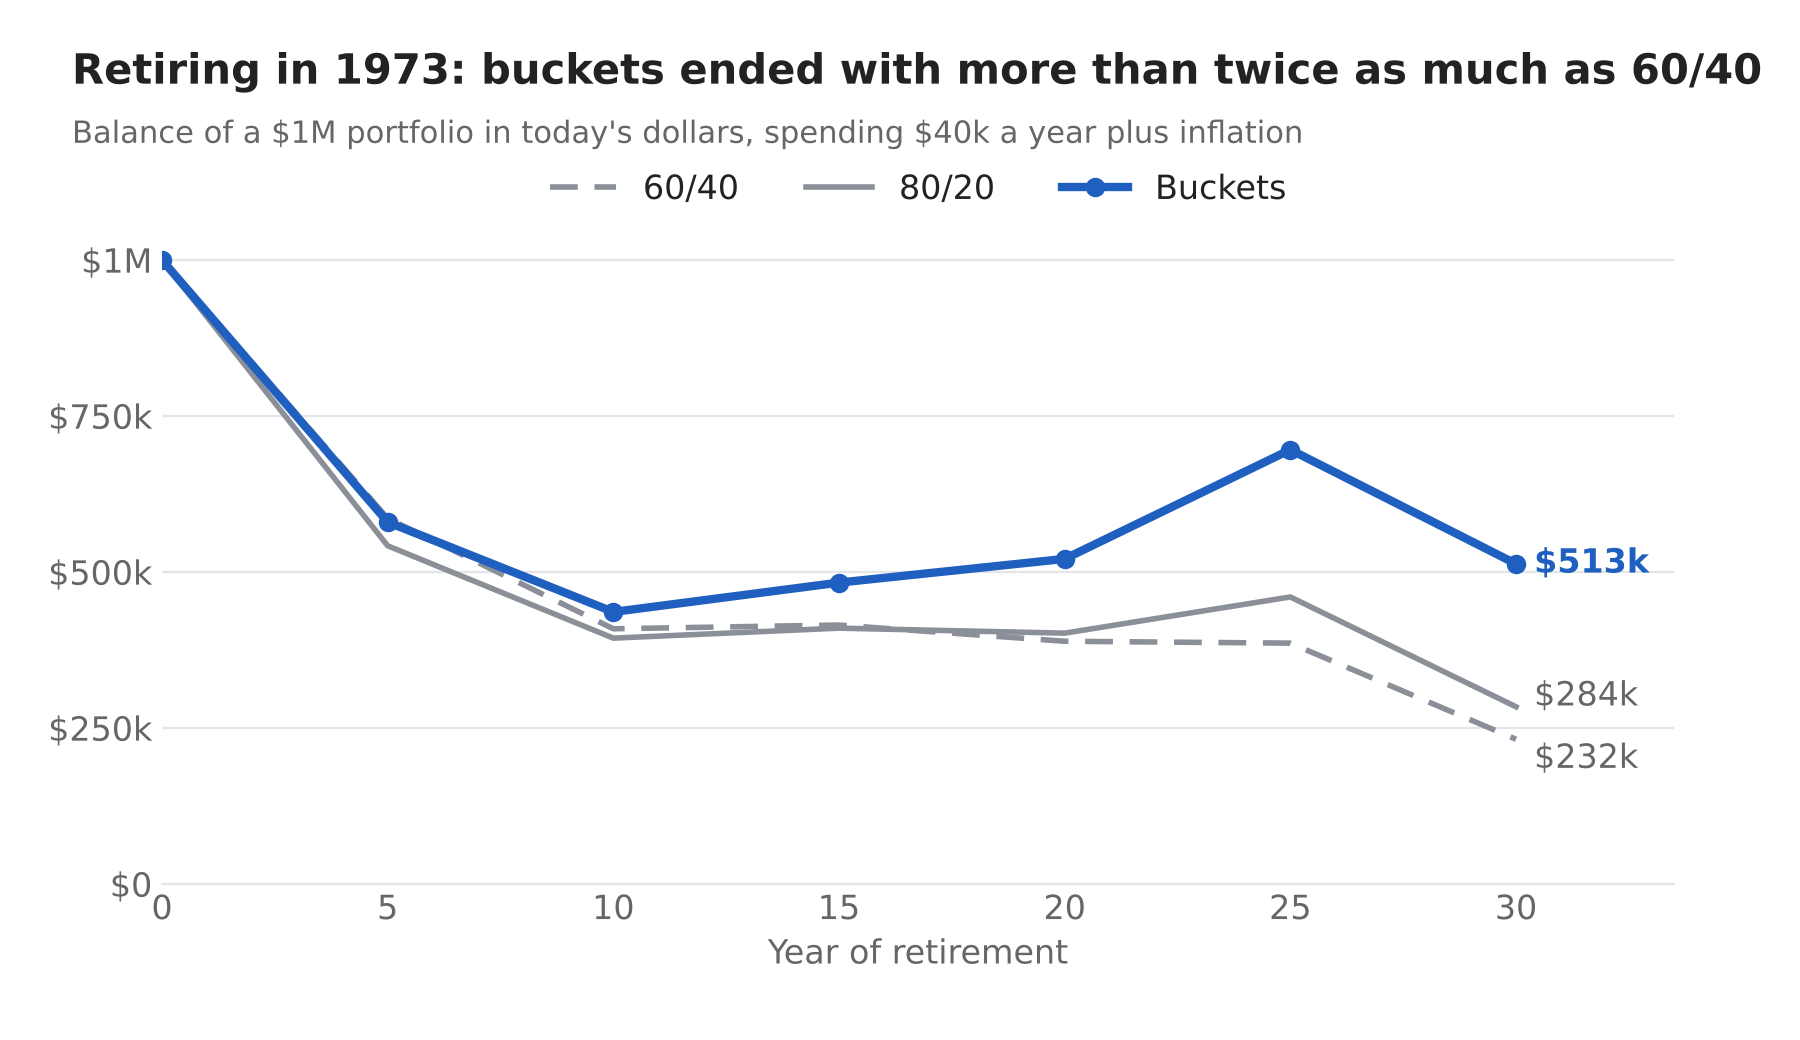
1973 is a famously hard year to retire. Stocks fell sharply right away and inflation ran hot.
Starting with $1 million, here is what was left after 30 years:
Sound Retirement Planning analysis of Damodaran (NYU Stern) data, 1973 start. Hypothetical.
The buckets did not avoid the early losses. But the first nine years of spending came from the cash bucket and then the two middle buckets, which hold a mix of stocks and bonds, so the retiree was not forced to sell the stock-heavy bucket while it was down, and the stock-heavy bucket had time to recover.
When buckets did not help
Be careful with the claim that buckets work in every starting year. They do not.
- Retirements that started in 1965, 1966 and 1968 ran out of money under almost every approach we tested, buckets included. Those years combined weak markets with high inflation, and in our data a 4% inflation-adjusted withdrawal was too much. Our results for these years are more pessimistic than William Bengen's original 4% rule research, which found that 4% held up through them. The main reason appears to be the bond data. Bengen used intermediate-term Treasuries, while we used 10-year Treasuries, which lose more when interest rates rise, as they did in the late 1960s and 1970s. When we tested intermediate-term bond returns in our model, a 4% withdrawal lasted much longer in these years, in line with his results. The outcomes in the hardest years depend on the bond data, so treat them as approximate.
- Against 80/20, the buckets finished lower in most periods (51 of 68), including some mid-1960s starts such as 1962 and 1964.
- In strong markets, an all-in 80/20 portfolio earned more.
Are buckets just an asset allocation in disguise?
The most famous criticism comes from Michael Kitces, who wrote that bucket strategies are an "asset allocation mirage." His argument, in plain terms:
- If you add up all the buckets, you get a single stock and bond mix. In his examples it comes out to roughly 40/60 to 60/40, like what a conservative or moderate investor would pick anyway.
- So the buckets do not change the investments you actually own. They change how you organize and think about them.
- That organization may still be valuable. When you can see your next several years of spending set aside in cash and lower-risk investments, it may be easier to stay calm and avoid selling stocks in a crash.
Where our test agrees with Kitces: The starting mix of our buckets, about 64% stocks, is right in the range he describes. And the benefit of calm, visible, lower-risk spending money is real, even though we did not measure it.
Where it differs: how the buckets are built. The design of a bucket plan matters a great deal, and not all bucket plans are the same. In the version Kitces describes, each bucket holds a different kind of investment: cash and short-term bonds first, then bonds with a modest amount of stocks, then stocks for the long term. You spend one bucket, then the next. Because each bucket is mostly one kind of asset, there is little to rebalance inside it. A plan built this way can miss the benefit of rebalancing, which is selling what has risen and buying what has fallen. That is our reading of his example, not a claim he makes in those words.
Our version is built differently. Each time period gets its own stock and bond mix: Bucket 2 is 40/60, Bucket 3 is 60/40 and Bucket 4 is 80/20. Buckets 2, 3 and 4 are each rebalanced every year, so the benefit of selling what has risen and buying what has fallen is kept. The plan also never refills the buckets, so the overall blend changes over time and becomes a rising stock allocation. Kitces has also written about rising stock allocations in retirement, as has John Antolak in his bucket simulator work, and the next section tests how much of our result comes from that.
Simple to run: Many bucket plans need refill rules that say when to move money from one bucket to another, and those rules can get complicated. This plan has none. You spend from Bucket 1 until it is empty, then Bucket 2, then Bucket 3, then Bucket 4. The only yearly task is rebalancing inside Buckets 2, 3 and 4. That simplicity is a benefit on its own, because a plan that is easy to follow is easier to stick with. It also fits what this type of strategy is meant to do: help protect a retiree from a poor sequence of returns right at the start of retirement, when losses do the most damage. That is the job the buckets are built for, and a plan that is simple to follow is easier to keep following when markets are at their worst.
What we would not claim: that buckets create returns out of thin air. The benefit here comes from the design, which starts with less risk and ends with more stocks, not from the bucket labels.
Is it the buckets, or just the rising stock allocation?
To separate the two, we also ran a plain portfolio with no buckets. It starts at 64% stocks and rises in a straight line to 80% over 10 years, about 1.6 percentage points more in stocks each year, then stays at 80% for the final 20 years. The portfolio is rebalanced every year to that year's target, and everything else matches the bucket test: $1,000,000 to start, $40,000 a year raised for inflation, and results in today's dollars. We chose this path to roughly match what the buckets do on their own. In the typical case the buckets reach about 79% stocks by year 10, but their actual path varies by starting year, so the match is approximate.
The buckets finished ahead in 48 of 68 periods and the plain path in 18, with 2 tied. The results are close. Most of the benefit comes from starting with less in stocks and ending with more, not from the bucket labels, and the buckets add only a modest edge here.
What a backtest cannot measure: staying invested
A backtest assumes the retiree never changes course. Real people do. A retiree who watches a portfolio fall 40% in the first few years may sell stocks near the bottom, and that can matter more than any difference in the math above.
This is where buckets may earn their keep. The next nine years of spending sit in the first three buckets, cash and two stock and bond mixes, one conservative and one moderate, where the retiree can see them, and the stock bucket is not needed until at least year 10. Kitces makes a similar point, that the psychological benefit may be the real value of buckets, while noting that the evidence for it is not well tested.
We did not measure this, so treat it as a reasonable argument, not a result. But if the math is about equal to a simple rising path, as the table above suggests, the behavioral case is the strongest reason to prefer buckets.
What to take away
- A bucket plan that spends the cash and lower-risk buckets first and lets the stock money grow can protect against a rough start to retirement.
- It does this without giving up all of the long-term growth of a stock-heavy portfolio.
- It is not magic. In our data, some starting years are too hard for any strategy at a 4% withdrawal.
- It keeps the rebalancing benefit, because Buckets 2, 3 and 4 are each rebalanced every year.
- It is simple. With no refill rules, you spend each bucket in order and rebalance the three invested buckets once a year.
- The mental benefit of seeing your spending covered for years ahead may matter as much as the math.
Important limits
- These are hypothetical results based on past data (1928 to 2024). The future may look different, and past performance does not guarantee future results.
- The 68 starting years overlap heavily. They are not 68 independent tests, and the data contains only a few truly distinct bad periods.
- Stocks are the S&P 500, bonds are 10-year U.S. Treasuries, and cash is Treasury bills. Ten-year bonds fall more than intermediate-term bonds when interest rates rise, so our results in the hardest years, such as the mid-1960s starts, may be more pessimistic than results using intermediate-term bonds. We ignored taxes, fees and Social Security.
- This is not personalized advice. Your own plan should reflect your spending, income, taxes and comfort with risk.
- The last starting year we can test is 1995, because a retirement that begins in 1995 runs 30 years, through 2024. Retirements that began in 2000 or 2007 are not included.
- We tested several bucket designs before settling on this one, which can make results look better than they would on a design chosen in advance. Testing on other countries' data would help.
- Stock, bond and T-bill returns were checked against Damodaran's January 2026 data file and match for every year. Inflation was checked against the FRED CPI-U series (December to December) and matches in 96 of 97 years. The 2024 figure differs by 0.14 percentage points, which changes no result.
- We tested one withdrawal rate (4%) with no spending flexibility. Real retirees can cut spending in a bad market.
Data: Aswath Damodaran, NYU Stern, historical returns for U.S. stocks, bonds, T-bills and inflation. Analysis by Sound Retirement Planning.
Sources: Aswath Damodaran, NYU Stern, historical returns · Michael Kitces, "Are Retirement Bucket Strategies An Asset Allocation Mirage?" · John Antolak, "Fill the Buckets and Glide Away", which also discusses rising stock allocations · Wade Pfau and Michael Kitces, "Reducing Retirement Risk with a Rising Equity Glide-Path", the research behind the rising glide path idea · William Bengen, "Determining Withdrawal Rates Using Historical Data", the original 4% rule research · Ibbotson and Sinquefield, "Stocks, Bonds, Bills, and Inflation: Historical Returns (1926-1987)", the source of the intermediate-term bond returns we tested.
About this article: We used Claude, an AI assistant made by Anthropic, to help create this article and the retirement bucket simulator. Claude helped run the historical backtests, build the charts, workbook and simulator, and draft and edit the text. The strategy design and the decisions about what to publish are ours. The data sources are listed above, and we encourage you to check the figures yourself.